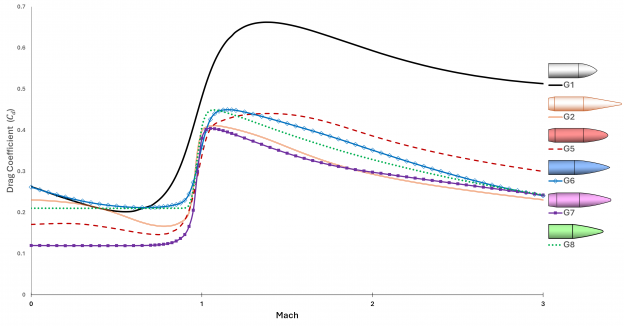
The last post mentioned the standard ballistic drag curves. Here is a chart of them for speeds up to Mach 3:
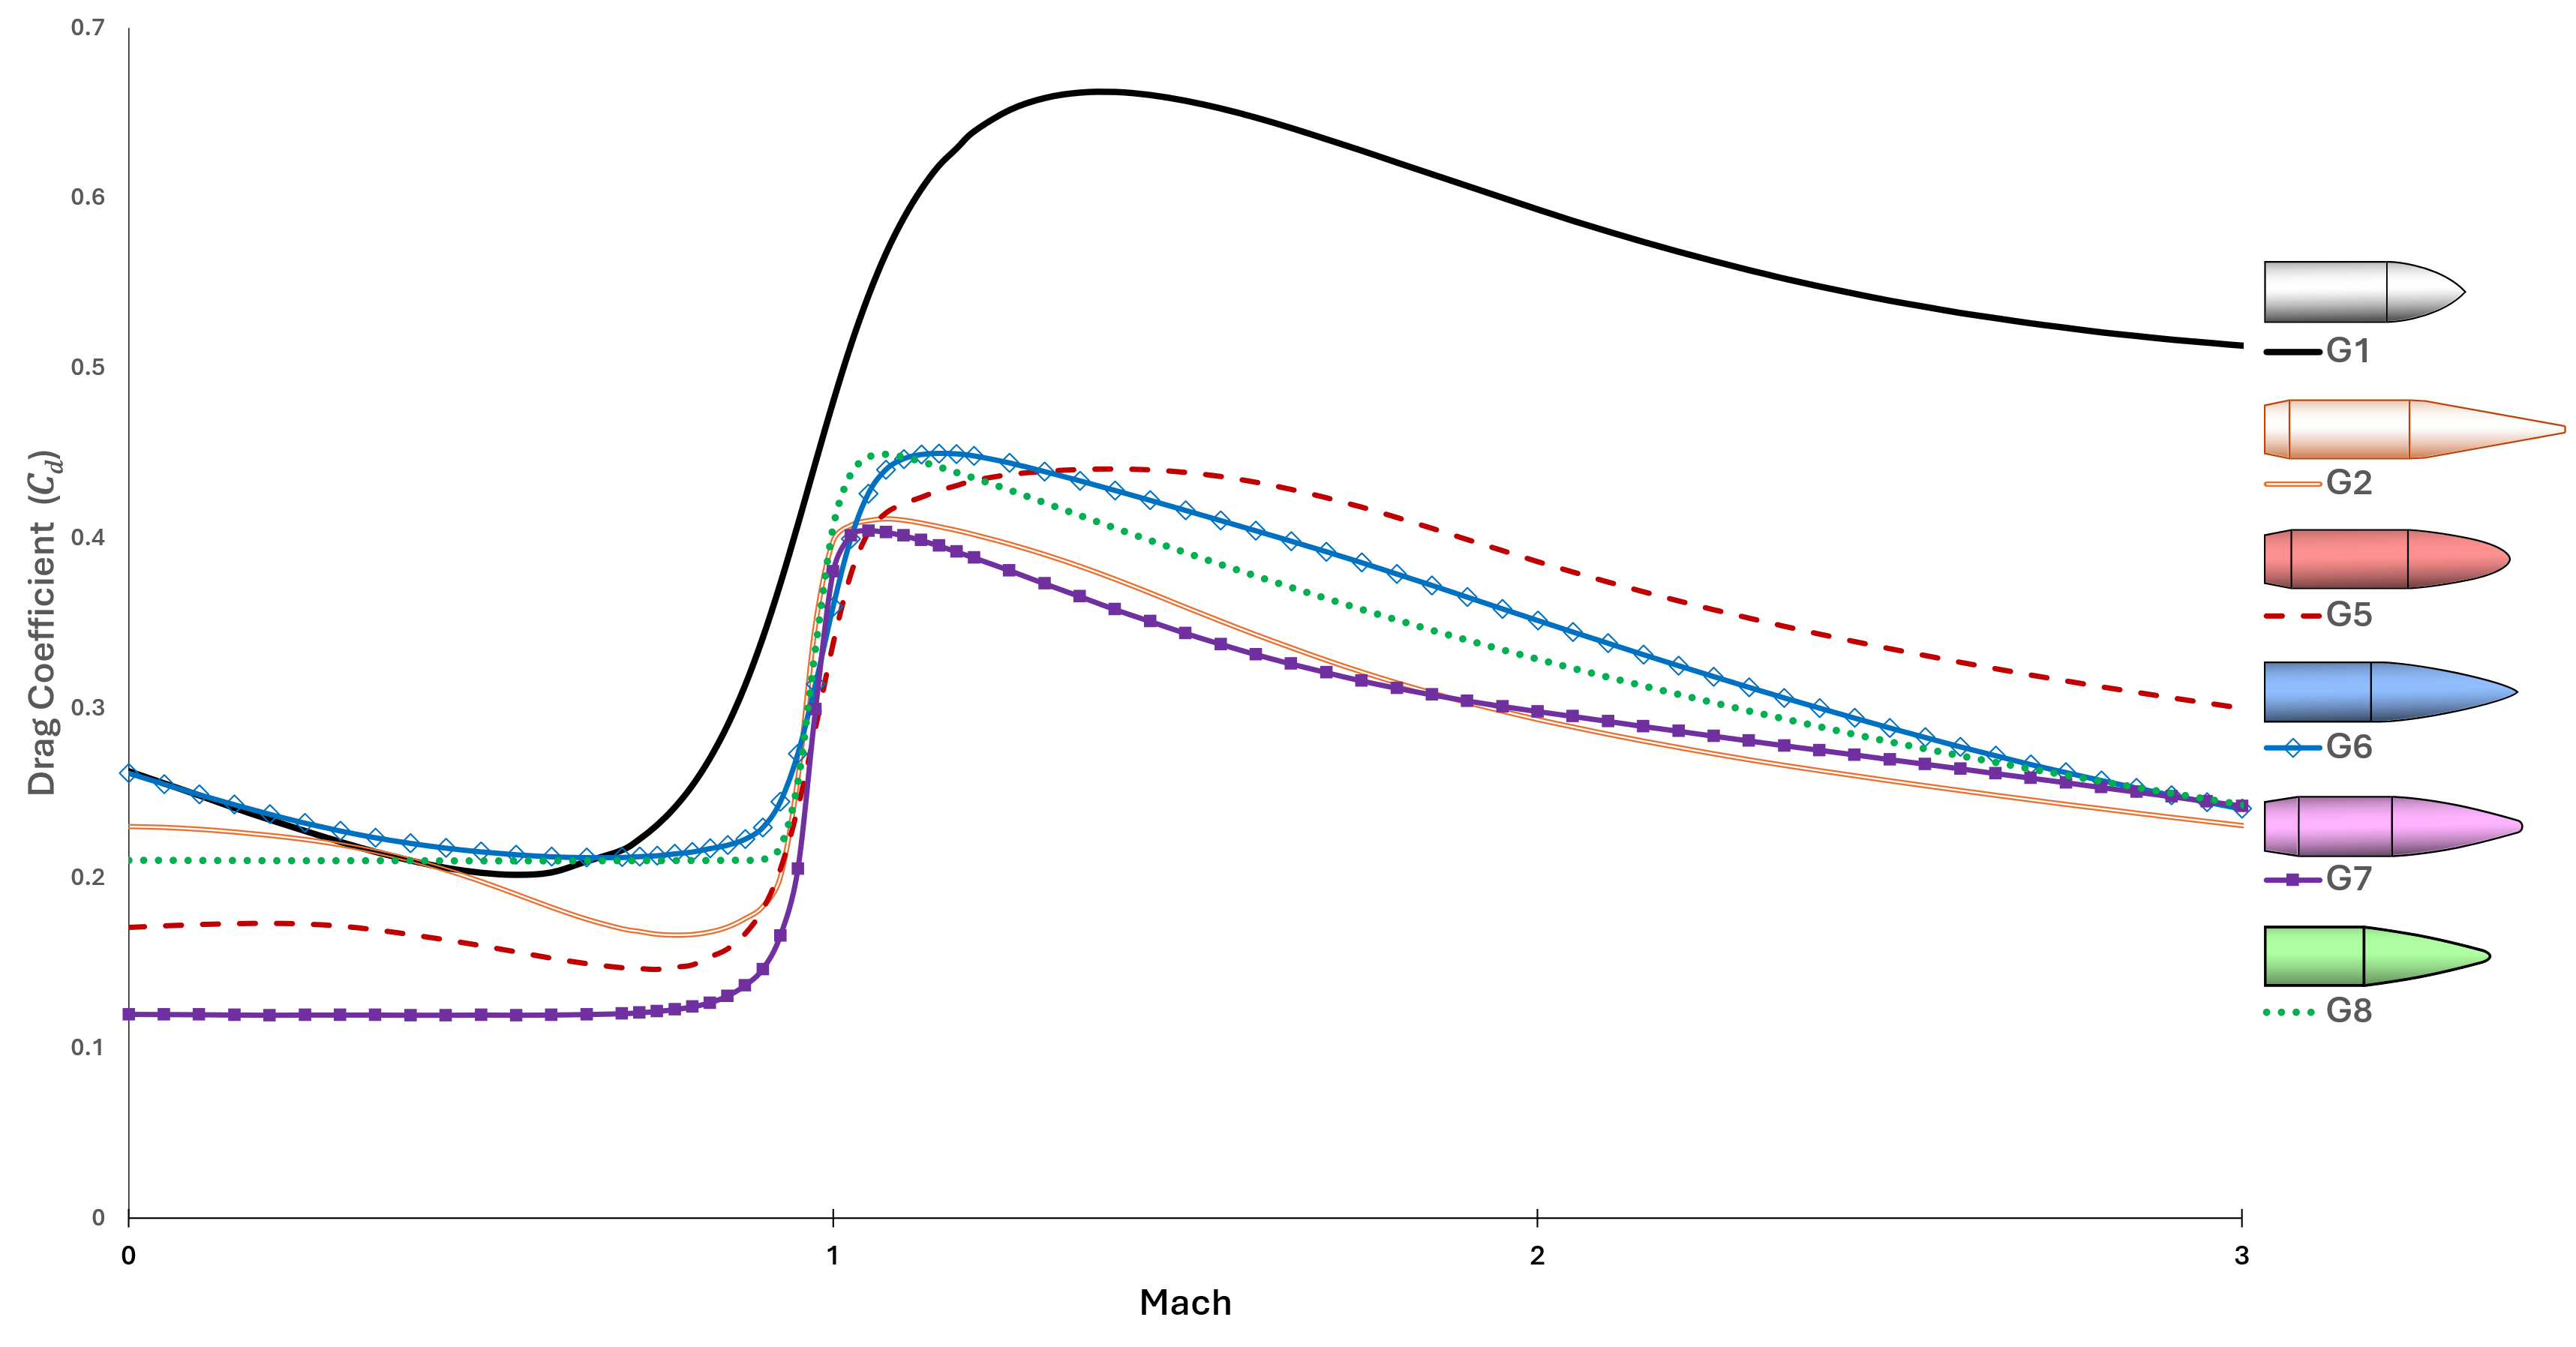
This chart reveals a few quirks of the standard drag models. First is that G1 is not very precise in the transonic region (i.e., about Mach 1). The reality of the sound barrier is reflected in the other curves, where drag hits a steep cliff that doubles or triples the subsonic drag coefficient. The more gentle slope of the G1 curve is a result of 19th century ballisticians failing to adjust aggregate test data for variations in the speed of sound.
Looking at the low subsonic region we find another strange artifact: several of the curves show an increase in drag as speed goes to zero. The reality is that drag should be virtually constant across low subsonic speeds. I asked Jeff Siewert what is going on here and he explained: Back in the day, the test ranges reported what they observed, and at those low speeds the projectiles (especially G2) were likely encountering dynamic instability that increased their yaw. So those segments reflect an increasing aerodynamic cross-section, not the (constant) drag that would be seen in stable, nose-forward flight.
Example: .308 OTM
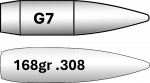
Let’s look at a typical rifle bullet: the 168gr .308 BTHP (boat-tail hollow-point), a.k.a. open-tip match (OTM). The profile of this bullet looks very close to the G7 standard projectile, as shown in this image with scaled profiles of the two:
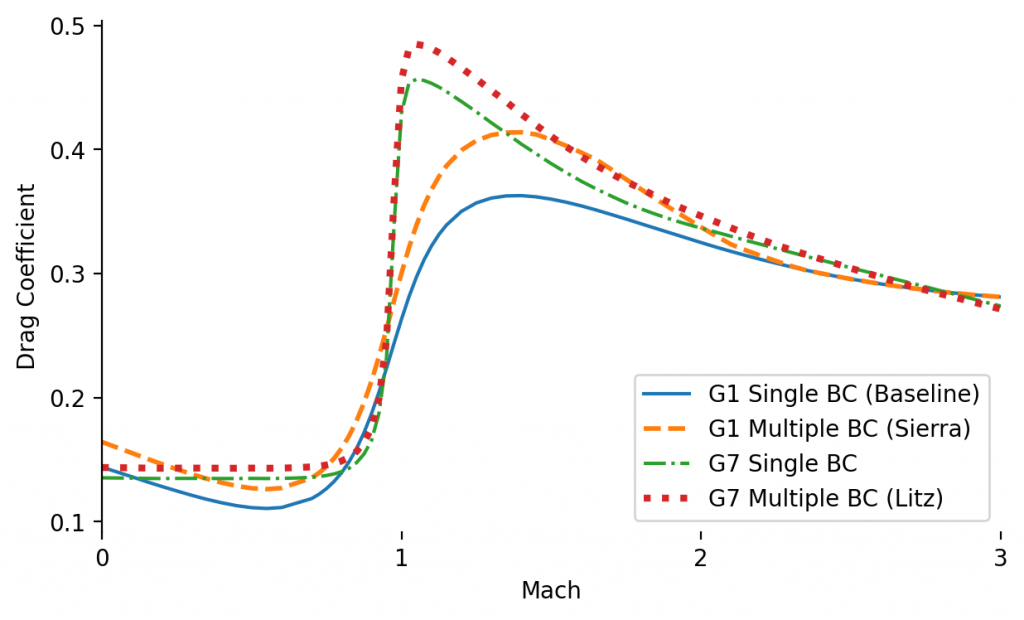
Manufacturers of this bullet still list a Ballistic Coefficient (BC) of 0.462 for use with the G1 drag model. A few decades ago, in an effort to improve trajectory predictions, Sierra published multiple G1 BCs for different velocity ranges: 0.462 above 2600 fps, 0.447 above 2100 fps, 0.424 above 1600 fps, and 0.405 below that. Eventually Berger began to publish G7 BCs, and this bullet is often quoted with a G7 BC of 0.224. A decade ago Bryan Litz began publishing detailed drag models for rifle bullets. For Sierra’s version of this bullet he lists multiple G7 BCs: 0.226 above 3000fps, 0.222 at 2500fps, 0.214 at 2000fps, and 0.211 below 1500fps. Here is a chart of the drag curves resulting from each of these variations:
Long-Range Consequences
How meaningful are these differences? I ran the trajectory for each model using a muzzle velocity of 3000fps, zeroed at 500 yards. Here are the drops on the baseline (G1) trajectory, and then the additional drop when using each of the other drag curves:
| Distance (yards) | Drop (inches) | G1 Multi | G7 | G7 Multi |
| 500 | 0 | 0.1 | 0.6 | 0.6 |
| 1000 | 233 | 8.7 | 10.3 | 16.3 |
| 1500 | 962 | 78.5 | 95.9 | 142.5 |
So there’s not a meaningful difference until we’re looking at ranges closer to 1,000 yards. At longer ranges, however, the vertical error from the inferior models is measured in feet!