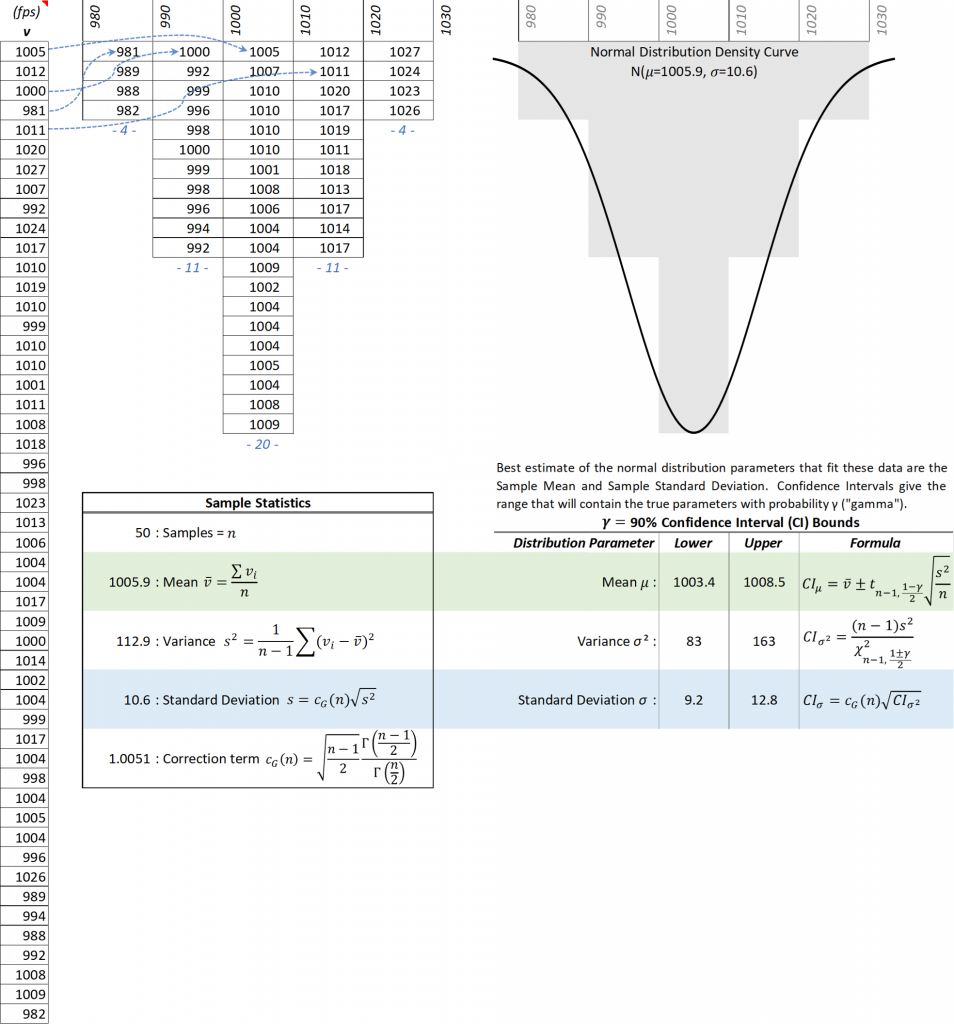
I’m putting together a book with a lot of statistics applied to ballistics and trying to fill it with helpful examples since the pure math is hard to absorb. Below is one infographic I just finished. It’s an analysis of the muzzle velocity I measured shooting a full box of subsonic .22LR. The left column is all 50 measurements, which I then sort into a histogram to illustrate how muzzle velocity is normally distributed.

That would have been my first guess. The error in most every physical process is normally distributed. Or log-normal, which I think technically is the case here as well because velocity is bounded by zero for the projectile. But it is so far away from zero that it doesn’t matter.